9 Best Mobile App Metrics For Tracking User Engagement

Thanks to the readily available app analytics tools, it doesn’t take much to generate mobile app metrics.
Even the App Store and Google Play Store have tried to make it all satisfyingly seamless with native mobile app analytics tools. You should be able to retrieve mobile app metrics for App Store Optimization (ASO), app installs, app users, app downloads, app usage, user devices, app performance, app promotion, etc.
Table of Content
- What Is Mobile App User Engagement?
- How To Track User Engagement: 9 Key Mobile App Metrics
- #1. Number of active users (MAU, WAU, and DAU)
- #2. App Sessions
- #3. App Stickiness
- #4. App Screen Flow
- #5. Click-through rate (CTR)
- #6. Conversion Rate
- #7. Bounce Rate
- #8. User Retention Rate
- #9. App Churn Rate
- #10. One Last Thing…
- Key Takeaways
Here’s the kicker, though. While anyone can easily generate mobile app metrics, only a handful have the skills to interpret it all.
Think about it. Although the information is usually laid out in readable form, mobile app metrics can get pretty confusing during analysis and interpretation.

The challenge for most people is transforming the data from its raw form into actionable insights. And to be specific, many of us have difficulties determining:
- What to take as mobile app KPIs (Key Performance Indicators).
- What to ignore as fluff.
- What to prioritize.
- How to work out performance.
- How to sort it all out.
- What to derive for the data.
- How to draw meaningful conclusions.
- How to respond to the resultant insights.
You could, of course, argue that data analytics isn’t everyone’s cup of tea. But then here’s the thing – after managing app projects for over a decade, I can confirm that the blueprint for app success comes from mobile app metrics. It’s only by tracking the right parameters that you’ll be able to respond accordingly to various market variables.
So, this is not really a matter of choice. You have to know how to work with the numbers if you hope to achieve mobile app success.
If you’re seeking to learn the basics, I’d recommend this guide on How To Track Mobile App Marketing. It provides an overview of key app marketing metrics, in-app analytics, and the corresponding mobile app KPIs.
Otherwise, for people who already have a solid grasp of the essentials, I guess it’s only right we delved into what comes naturally with mobile app marketing and user acquisition.
This is the ultimate guide for anyone seeking to learn how to properly track user engagement, analyze app usage patterns, and draw actionable insights from the analytics. You even get to find out the formulas behind the app KPIs, and their significance to user engagement optimization.
But first, what exactly do we mean by “user engagement”?
What Is Mobile App User Engagement?
Mobile app user engagement refers to all the direct and indirect interactions that people have with your app after download and installation.
Typically, this should come as the second stage in the lifecycle of a mobile app user.
The journey itself begins with user acquisition, which comprises all the activities that generate new app users. This is where you aggressively engage in pre-launch app marketing, as well as paid promotions for driving app discovery, app downloading, and app installation.
User engagement, then begins once the new user has gotten on board. This is when new acquisitions become bonafide app users, with privileges for operating the mobile app.
In essence, each action, reaction, and response instance directed to the mobile app is recorded as user engagement.
Common examples of user engagement include making subscriptions, registering, purchasing, signing in, messaging, playing games, creating a profile, customizing app layout, typing, etc.
The scope itself covers the actions taken by users, the time they spend within the app, plus the process of uninstalling the mobile app.
This whole time, mobile users are seeking to get the best possible value from the app, while app owners tend to focus on maximizing app usage for the sake of revenue generation. The longer you keep users on the app, the higher the revenue you stand to generate from them.
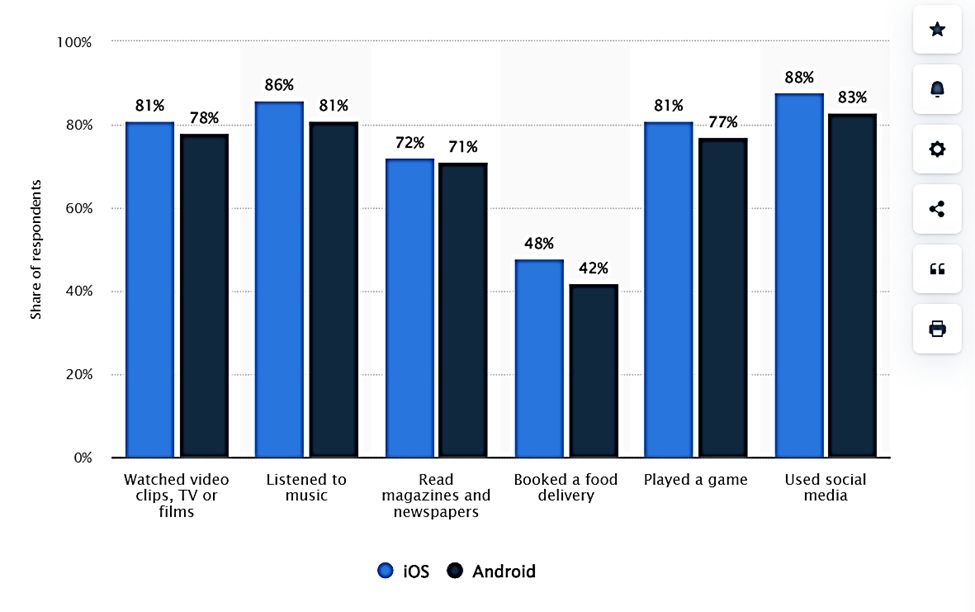
To put it into perspective, consider the revenue figures from the App Store and the Google Play Store, and then compare them to the corresponding app usage trends. iOS users being slightly more active than their Android counterparts ultimately translates into more revenue for App Store apps.
All in all, the point of user engagement metrics is not only to measure the level of app usage but also to keep track of how users are responding to app experience variables.
Such insights are then used by mobile app marketers to make strategic decisions on various measures intended to maximize interactions within the app and keep users interested.
For example, marketers might try to improve apps by optimizing user experience – in the hope of raising their app user retention rate and subsequently increasing ROI. All these steps are, of course, informed by data KPIs drawn from app usage patterns, along with app churns, and app installations.
App engagement optimization is also approached from the users’ side. Marketers assess audience information to learn more about them, and in turn, use the findings to create a stronger bond. The objective is to give users the impression that they’re valued, and subsequently get them to keep coming back for more gratification.
How To Track User Engagement: 9 Key Mobile App Metrics
#1. Number of active users (MAU, WAU, and DAU)
To establish the number of people using your app, you just need to track the metrics for all active users within a specified period of time.
The term “active users” was reportedly made popular by Google Analytics. And according to the platform, an active user is any individual who opens your application and then proceeds to perform an activity within the app.
That essentially means that while all active users are engaged users, not all engaged users qualify to be active users. Only the ones who go on to use the app can be described as such.
Thankfully, you won’t need any premium app analytics tools to track the figures. iOS app publishers can retrieve them from their App Store Connect account, while Android developers should get theirs from the Google Play Console.
Whichever applies to you, keep in mind that the number of active users isn’t really a cumulative sum of all the app sessions. Rather, the tracking is usually in the following periodic cycles:
- Monthly Active Users (MAU): Just as the name suggests, MAU reveals the number of active users recorded within a 30-day period. App Store Connect and Google Play Console usually report all your app sessions within the month as one active user. That means the tally doesn’t increase with each log-in or app usage instance. Hence, this is a reliable way of figuring out the size of your mobile app’s engaged audience.Take, for instance, the case of WhatsApp. While the mobile app itself boasts a total of more than 5 billion downloads, the official count of users is obtained from its MAU of 2 billion.
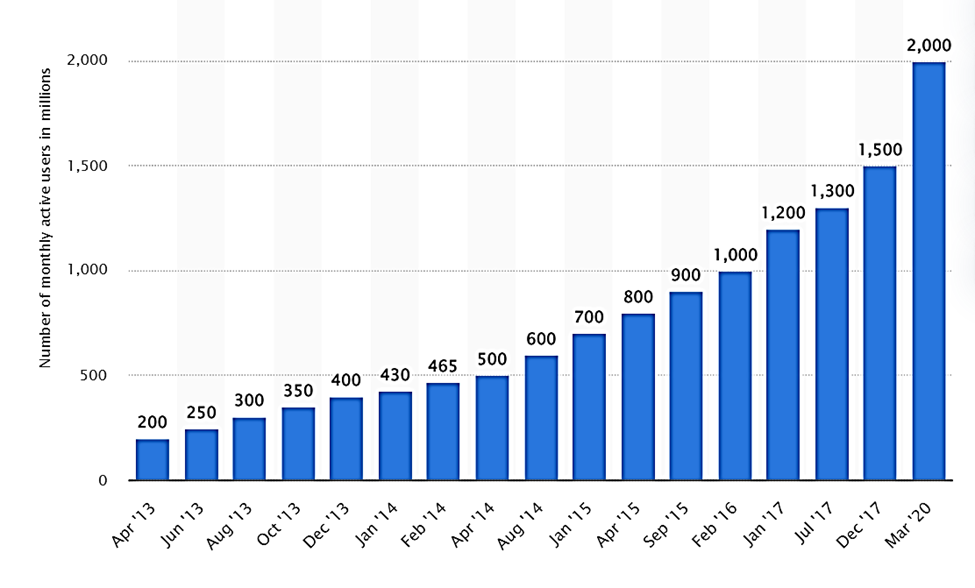
The number of monthly active users on WhatsApp. Source: Statista - Weekly Active Users (WAU): Weekly Active Users refers to the number of unique single users who’ve interacted with your app at any point within a period of 7 days. By breaking down the MAU into WAU, you get to establish the number of people who are regularly engaged.
- Daily Active Users (DAU): The metrics for Daily Active Users focus specifically on the individuals who’ve interacted with your app within a 24-hour period.
By taking your app’s DAU values over several days and working out the average, you get to find out the share of highly-engaged users.
In the case of WhatsApp, the number of Daily Active Users is reportedly 1 billion – which essentially translates into an impressive 50% user engagement rate per day.
It’s worth noting, however, that while many apps happen to qualify any activity performed as “active user”, you’re free to restrict yours to a specific action or set of tasks.
For instance – if you’re running an eCommerce app, you could set your analytics system to count only the ones who make purchases as active users. Then for a dating app, you may focus on actions like messaging, commenting, liking, updating statuses, and profile sampling.
If you choose to take this approach, you might want to map out the app’s user journey and then prioritize the activities that directly lead to revenue generation. This would, of course, leave out all the other forms of user engagement.
#2. App sessions
While MAU, WAU, and DAU reveal the number of unique users running your app, you can’t really tell the number of times users are accessing the app.
Now, for such details, you’ll have to switch specifically to the mobile app metrics for app sessions. This is where you get to track user engagement in terms of the app usage instances. Each session is tracked separately before being included in the final tally.
The metrics to prioritize here are…
- Average Session Length: This shows the average amount of time users are spending in your app per session. You can think of it as an indicator of how long a typical session lasts on your mobile app.Each session begins the moment a user performs the first action after opening the app, and then runs until the final action before leaving the app. This is meant to give you a clear picture of how long users are actively interacting with the mobile app.The formula itself is quite straightforward. You should be able to work out the Average Session Length by dividing the total cumulative amount of time your app has been used by the total count of app sessions.
Average Session Length = Total app usage time / Number of app sessions
Your goal here should be to maintain anything well above the standard average – which is 5.6 minutes for iOS apps and 6.6 minutes for Android apps.
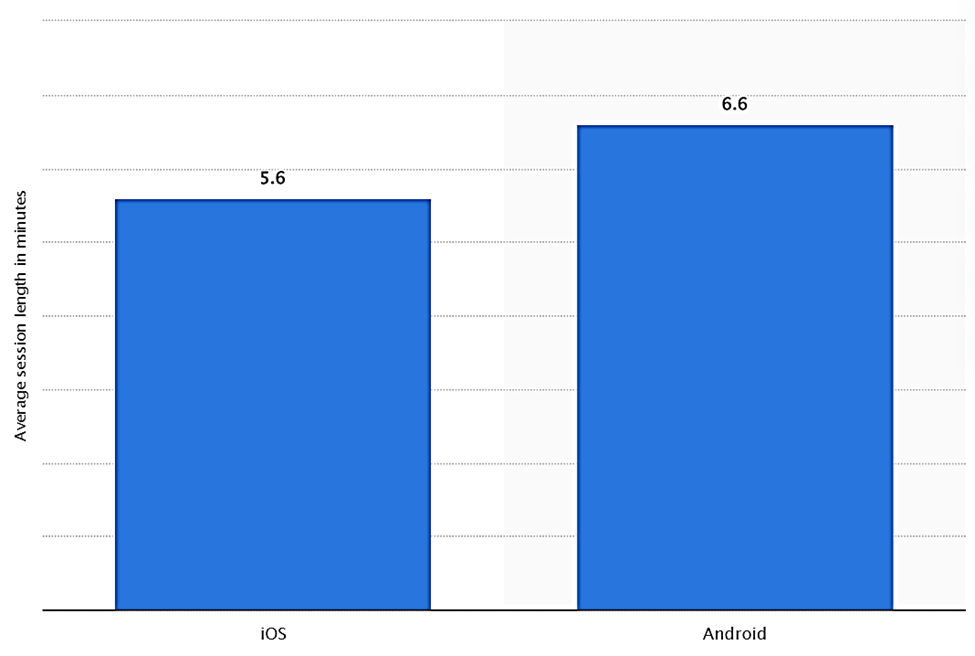
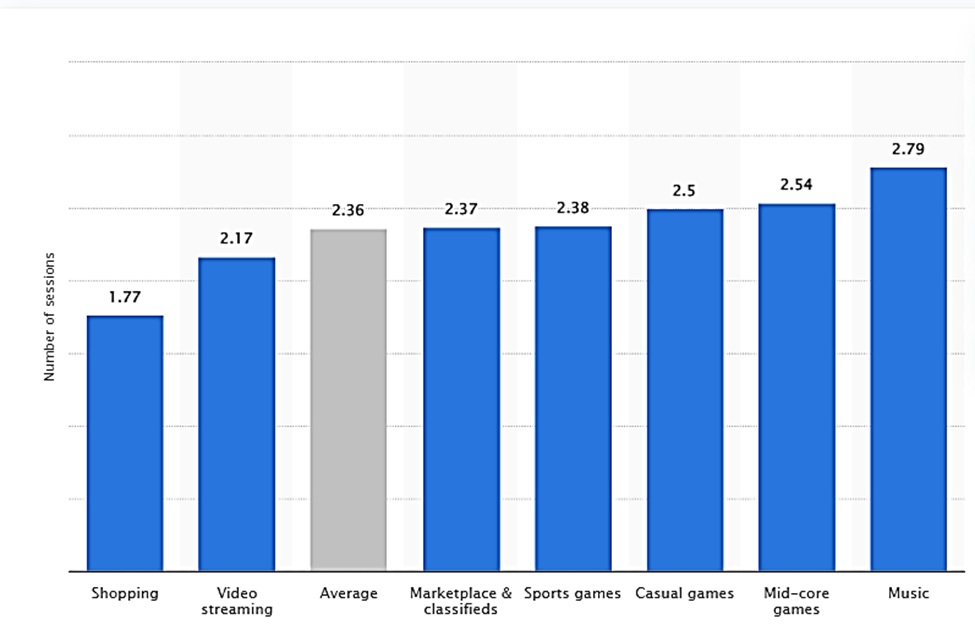
Average session length for iOS and Android apps. Source: Statista - Average Daily Sessions Per User: Average Daily Sessions Per User metrics offer insights into the number of times users are running your app per day. In other words, you’ll be able to tell how many times an average Daily Active User (DAU) is relaunching the app to carry out activities.This is calculated by dividing the total number of sessions recorded per day by the corresponding count of Daily Active Users.
Average Daily Sessions Per User = Total number of sessions in a day / DAU
So far, the average for all mobile apps is 2.36 sessions – with shopping apps going as low as 1.77, while music apps are registering 2.79. To remain competitive, therefore, you need to maintain a score of several sessions per day.
Average daily app sessions per user. Source: Statista - Session Interval: Session Interval refers to the amount of time your app users take to start a new session after closing the app. This is meant to quantify the time periods between two consecutive app sessions per user.The smaller the session interval, the higher the app user engagement rate. So, you should seek to cut down on the metrics as much as possible.
iOS app publishers should be able to track their session count from the App Store Connect. At least it’s capable of tracking the metrics over a specific period.
The Google Play Console, on the other hand, requires you to set the type of event you’d like to track in the app sessions.
#3. App Stickiness
Speaking of sessions, one of the best metrics for establishing your average user return rate is app stickiness.
The name alone speaks for itself. A sticky app would be one that is addictive enough to keep its users always coming for more. So, in other words, you can take app stickiness as the ultimate user engagement measure for loyalty and usage frequency.
This value is typically expressed as a percentage, worked out from the ratio of the Daily Active Users to the Monthly Active Users.
You see, with MAU being a general indicator of the size of your userbase and DAU representing day-to-day users, juxtaposing the two would disclose the number of times each user might end up opening the app before the end of the month.
All it takes is dividing the number of Daily Active Users by the number of Monthly Active Users, and then multiplying the ratio by 100. The resultant value is a percentage representation of your app users’ return frequency in a month.
App Stickiness (%) = (Daily Active Users / Monthly Active Users) X 100%
Consider, for instance, a mobile app with 2,500 Monthly Active Users and 500 Daily Active Users. That would place the app stickiness at 20%, which represents 6 days in a 30-day month. In simple terms, therefore, you could conclude that an average user launches and utilizes the app over a period of 6 days in a 30-day month.
You should be able to track these mobile app metrics from your App Store Connect and Google Play Console accounts. And while you’re at it, you’ll notice that the user engagement levels increase as the difference between MAU and DAU decreases. The higher the percentage value, the better your app is at engaging users repeatedly.
That said, a good app should maintain a score of over 20%. And if you seek to make the app as engaging as Facebook and WhatsApp, use a benchmark of 50%.
#4. App screen flow
If there’s one thing your app users will never be willing to compromise on, it’s user experience. From the moment they first launch the app, they’ll be paying very close attention to the design, structure, navigation, and performance of the front-end. They want to get things done in the simplest, fastest, and most seamless way possible.
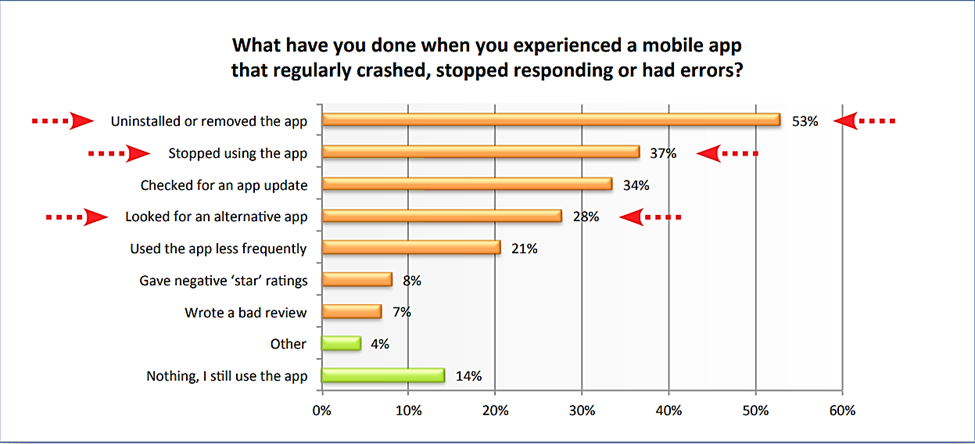
Poor performance alone has driven nearly 90% of users to stop using a mobile app. And as it turns out, only 1 in 26 complain when unsatisfied. The rest, 91%, never bother flagging up issues – they just leave.
So, if you’re looking to boost user engagement, you’ll have to perfectly optimize your app’s UI/UX – and since users are not always willing to share the problem areas, you’ll have to dig for the information yourself.
Now that’s where app screen flow metrics come in. These are real-world user experience analytics generated after strategically tracking app users as they navigate through different screens.
You basically set an automated tracker to keep tabs on how users interact with the app, as well as trace their journey as they navigate across various sections of the mobile app. Then from the resultant mobile app metrics, you’ll gain valuable insights into user behavior, usage patterns, plus in-app activities performed by users.
You should be able to figure out how your app users navigate between screens, the type of actions they are taking, how they engage the whole interface, their favorite app sections, as well as the screens with the highest churn rates.
To establish where you excel, for instance, you just need to sort out the user engagement metrics by interactions per screen. The ones that register the most interactions could stay, while the worst performers would have to be reworked.
If you’re seeking to increase your average session length, app screen flow insights will further assist you by pointing out the sections your most engaged users are spending their time on. You could then compare that to the flow metrics from the least engaged users, and then learn what to improve from the findings.
Then for someone hoping to reduce their app churn rate and enhance user retention, reverse flow analysis would provide the much-needed clarity. This is where you get to view the paths users typically take before leaving the mobile app.
Unfortunately, you won’t find these mobile app metrics on App Store Connect or Google Play Console. But, on the flip side, there are some pretty robust third-party tools out there to which you can entrust the job:
Examples include…
- Localytics
- Mixpanel
- Flurry
- UXCam
#5. Click-through rate (CTR)
If you ever launch an in-app campaign, you’ll want to know the number of app users responding to it. The most appropriate mobile app metric to track in such instances is CTR, or click-through rate in full.
CTR essentially defines the share of mobile app users who proceeded to click (or tap) on an offering after engaging with an ad, post, or promotion. Every single click is counted, and then the final sum is expressed as a percentage ratio to the total number of campaign impressions.
Click-through rate (%) = (Total number of clicks / Total reach) X 100
The objective here is to quantify campaign performance in terms of impressions that developed into actual clicks. Or, in other words, the percentage rate can be described as the part of the campaign audience that was engaged successfully.
You can use click-through rate to track audience response to in-app messages, push notifications, banner ads, mobile video ads, coupons, discounts, feature offerings, etc.
As such, CTR tracking is particularly useful to free mobile apps that rely on in-app ads for revenue generation. Their ad platforms even come with CTR analytics by default, consequently saving you the trouble of finding a compatible tracker.
If you’re targeting the highest possible CTR rates, I’d advise you to go with in-app videos. Developing them might not be as cheap alright – but, in the end, their intuitiveness and superior engagement translate into 7.5 times higher CTR than regular display ads.
#6. Conversion Rate
Now, don’t mistake click-through with conversion. Click-through is all about the campaign response clicks, while conversion follows when highly-engaged app users finally complete the desired goal.
We’re not talking about the App Store conversion data from app acquisition. Rather, this is about the post-install actions that mark a turning point in the customer’s journey. You could, in fact, think of it as the transition from a lead to a full customer, or an app installer to a patron, a free user to a premium user, and so forth.
In-app user activities that would be termed a form of conversion include making purchases, launching screens, upgrading packages, registering to a program, etc. As the app publisher, you have the liberty to set any targeted action as the conversion point. You can even set multiple conversion stages along your app’s user journey.
There’s just one thing. To monitor and accurately measure the conversions, you ought to specify the events accordingly on the tracking system. It’ll then present the figures as a percentage metric known as conversion rate.
Now, in essence, your conversion rate is computed by dividing the number of users who sailed through the targeted action by the total volume of users, and then multiplying the result by 100.
Conversion rate (%) = (Number of users who performed the target activity / Total volume of users) X 100%
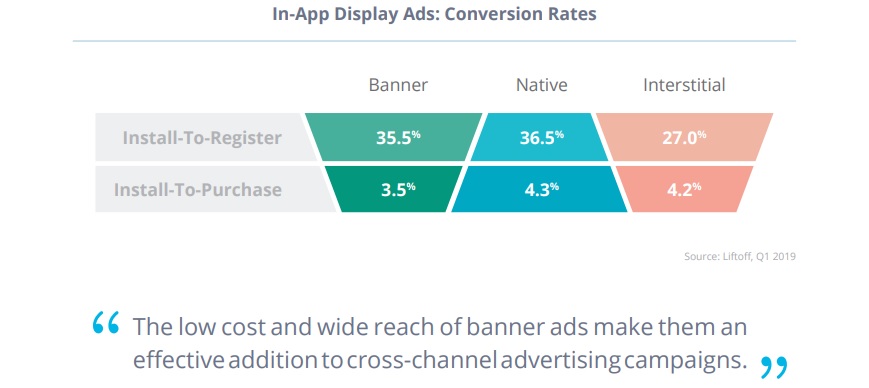
To put it into perspective, the average install-to-purchase conversion rate for in-app banner ads is 3.5%, while native ads generate 4.3%, followed by interstitial ads with 4.2%.
Some of the mobile app analytics tools that will help you with conversion rate tracking include:
- Flurry
- App Annie
- Countly
- Firebase
- Google Ads.
#7. Bounce Rate
As you continue monitoring your app screen flow, you might from time pick up on users who close the app immediately after launching it. They typically don’t stay long enough to explore what the app has to offer – they, instead, rush to close the app after only experiencing one screen.
Such short-lived sessions are technically known as “bounces”. And, although they might seem trivial at first, it’s always advisable to keep tabs on the occurrences by tracking your app’s bounce rate. What you get to discover here could help you transform the app’s user experience.
That said, the bounce rate itself is usually expressed as a percentage, derived from the ratio of quitters to the total number of app users.
Bounce Rate (%) = (Total number of individuals quitting after accessing one screen / Total number of app users) X 100
A good result here would be a low bounce rate of, say, less than 15%. And don’t be mistaken – even apps with solid stickiness and session analytics can have a worryingly high bounce rate.
Now, as it turns out, bounces are largely influenced by page loading speeds. The longer your mobile app takes to load, the more the number of users you stand to lose through bounces.
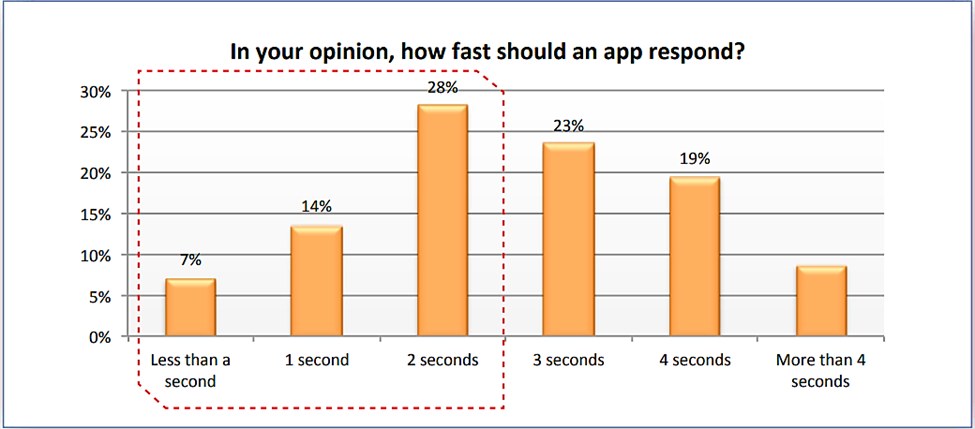
According to Google, a page load time of three seconds has a 32% higher bounce probability than one with a one-second load time. And if you stretch it to five seconds, the probability of bounce shoots to 90% over the page loading in one second.
So, you might need to minimize your page loading times as much as possible. You could start by maybe cleaning up the code to boost the data processing speeds.
#8. User Retention Rate
User retention rate deals with the number of app users that continue to engage with your app long after installation. This is an indicator of the share of users that you manage to keep as active users after acquisition.
In most cases, the app retention rate is tracked through a continuous sequence of three measuring periods — you get to find out how many users are still hanging around after 1 day, 7 days, or 30 days.
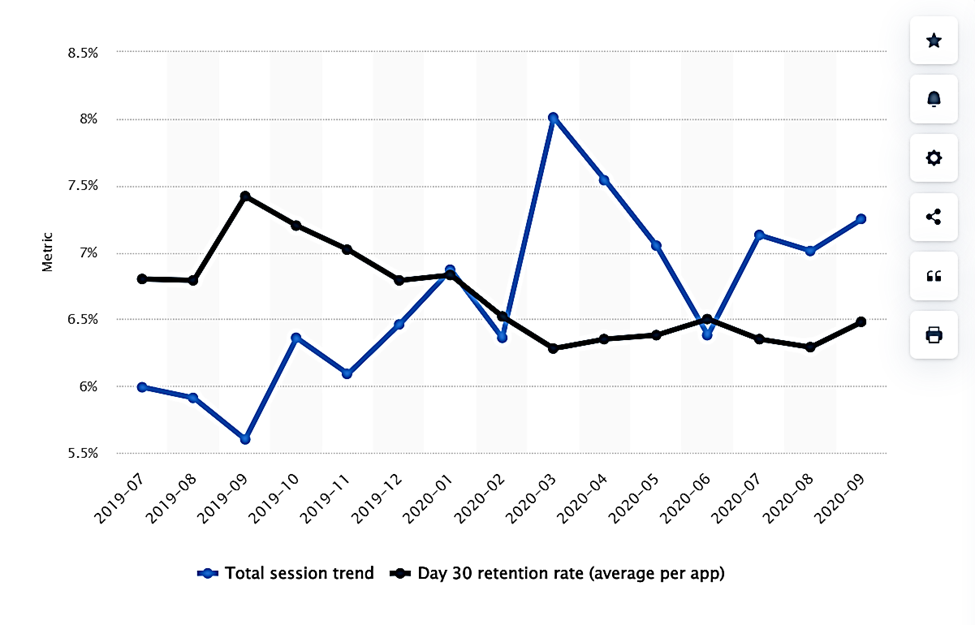
On day 30, for example, it turns out the global average retention rate per app ranges between 6.2% and 7.2% – which, interestingly, puts it on almost the same path as the corresponding app sessions.
Now, when it comes to the math, it just so happens there are several ways of calculating user retention rates across all three periods.
But, the simplest and most direct method entails expressing your app retention rate at the end of the set period as a percentage of the total number of new users at the beginning of the review period.
App Retention Rate (%) = (Total number of users remaining after a specified period / Total number of users acquired at the beginning of the specified period) X 100
Or rather, you can take the app retention rate formula as the number of new active users retained divided by the total number of new app installs at the beginning of the review period.
For example, imagine a mobile app that manages to gain 10,000 new users on the final day of the month of March. If only 1,000 of them remain by April 30th, then you’d have 10% as the average 30-day app retention rate.
The point of these mobile app metrics is to refine app install figures into a form that accurately reflects your true app growth. Instead of defining your app’s success based on the number of mobile app downloads acquired, you end up getting a clear picture of the number of active users who remain from the initial lot.
These are insights you can retrieve directly from App Store Connect and Google Play Console accounts. Both platforms break the figures down into an easily digestible form, and you get to filter the results by time to track your app’s progression.
That way, you’ll find it easier to align your user engagement and monetization strategies with your customer base. Plus, you’ll be able to keep an eye on how various engagements impact user loyalty on your mobile app.

#9. App Churn Rate
Put simply, your app churn rate is more or less the opposite of the user retention rate.
While app retention rate tracks the number of active users still going strong, app churn rate measures the volume of users withdrawing permanently from the app.
And just like user retention, app churn rate is expressed as a percentage. But, the ratio itself isn’t based on just the newly acquired users – rather, your app churn rate is worked out from the total number of users on your app.
That means that you just need to divide the number of users lost over a set period by the total number of app users at the beginning of the review period.
App Churn Rate (%) = (Number of users who withdrew over a specific period / Total number of app users at the beginning of the review period) X 100
Hence – for a mobile app that had 20,000 users at the beginning of April but then lost 2,000 by the end of the month, the 30-day churn rate would be worked out as 10%.
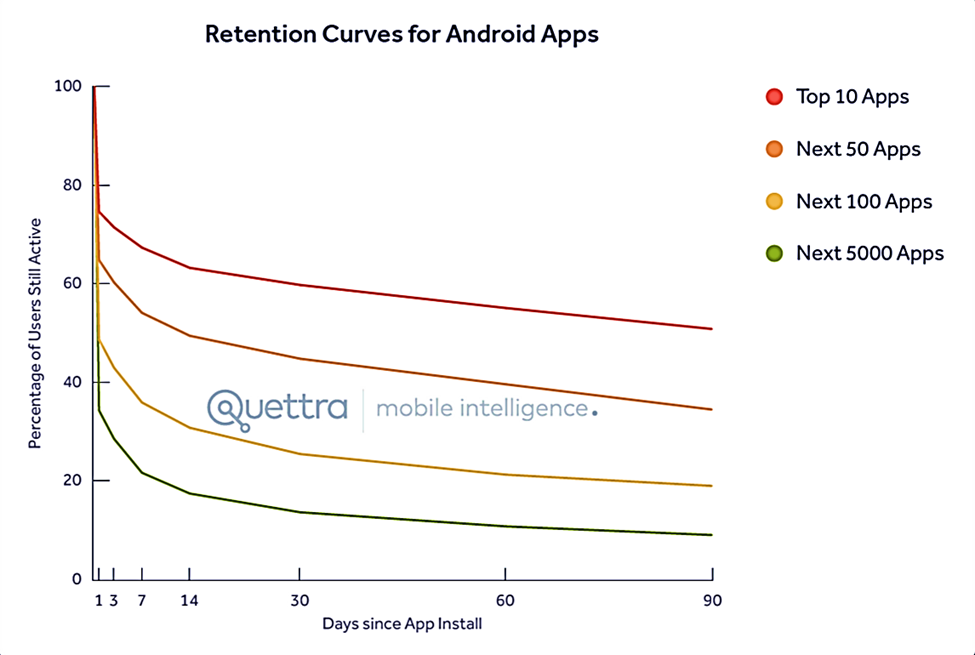
In the real world, however, you can expect much higher figures, as 80% of all app users tend to churn within three months. This was established by a study that sampled app usage data from over 125 million devices.
The objective of these mobile app metrics is to offer clarity into the aspects that might be compromising user experience within the app. When you follow up on the trends, you should be able to identify any possible pain points in the user engagement journey, after which you could piece together appropriate mitigation measures.
Other than that, you can compare your app churn rate with the corresponding user retention metrics to track the net growth rate of your app business.
If you see that app growth is slumping, you might want to reoptimize your app engagement and user experience attributes. At least that might seal a couple of loopholes that may have been contributing directly to the churn rate.
One Last Thing…
Combined, these mobile app metrics provide the much-needed head start in the form of insights for optimizing all the critical attributes of mobile app engagement.
You’ll be able to keep tabs on the number of active users engaging the app, usage trends across the app sessions, frequency of app engagement, the performance of critical UI/UX attributes, audience response to app ad campaigns, impressions from the first app screen, the level of user loyalty over the long haul, plus possible pain points that might be driving users away.
But, get this – to make all these work perfectly for your mobile app, you need to keep in mind two very critical pointers. These are the simple things that’ll ultimately make all the difference in the end.
For starters, the decisions that you’ll be making courtesy of the resultant insights will not be final. Instead, try to approach this with an open mind and think of engagement optimization as a continuous never-ending process.
Once the first round of optimizations is done, you still need to stay on top of business by tracking the mobile app metrics and then tweak stuff as user preferences shift.
Secondly, don’t get too caught up by user experience optimization that you end up underprioritizing other critical app growth processes.
You need your engagement campaigns intricately synced with strategic mobile app marketing in order to target the right audiences, engage them with well-personalized messages, and then take them through an omnichannel journey that will lead to long-term app user loyalty.
You can count on PreApps to piece all this together into a custom-tailored app growth plan for you, the app, and your app business. Contact us today and let’s have a chat about how you can capitalize on the same strategies we’ve used to drive over half a billion app users.

Key Takeaways: Mobile App KPIs For Driving App Engagement
To sum it all up, here are the key takeaways that you might want to keep in mind going forward:
- The challenge for most people is transforming mobile app analytics from its raw form into actionable insights.
- Mobile app user engagement refers to all the direct and indirect interactions that people have with your app after download and installation.
- The app user journey begins with user acquisition, which comprises pre-launch app marketing, as well as paid promotions for driving app discovery, app downloading, and app installation.
- App user engagement covers the actions taken by users, the time they spend within the app, plus the process of uninstalling the mobile app.
- iOS users being slightly more active than their Android counterparts ultimately translates into more revenue for App Store apps.
- All in all, the point of user engagement metrics is not only to measure the level of app usage, but also to keep track of how users are responding to app experience variables.
- Marketers assess audience information to learn more about them, and in turn, use the findings to create a stronger bond.
- You need your engagement campaigns intricately synced with strategic mobile app marketing.
- Stay on top of business by tracking the mobile app metrics and then tweaking stuff as user preferences shift.
- Think of engagement optimization as a continuous never-ending process.
- An active user is any individual who opens your application and then proceeds to perform an activity within the app.
- While all active users are engaged users, not all engaged users qualify to be active users.
- MAU reveals the number of active users recorded within a 30-day period.
- Weekly Active Users refers to the number of unique single users who’ve interacted with your app at any point within a period of 7 days.
- The metrics for Daily Active Users focus specifically on the individuals who’ve interacted with your app within a 24-hour period.
- While many apps happen to qualify any activity performed as “active user”, you’re free to restrict yours to a specific action or set of tasks.
- Average Session Length shows the average amount of time users are spending in your app per session.
- Average Session Length = Total app usage time / Number of app sessions.
- Average Daily Sessions Per User metrics offer insights into the number of times users are running your app per day.
- Average Daily Sessions Per User = Total number of sessions in a day / DAU.
- Session Interval refers to the amount of time your app users take to start a new session after closing the app.
- A sticky app would be one that is addictive enough to keep its users always coming for more.
- App Stickiness (%) = (Daily Active Users / Monthly Active Users) X 100%.
- A good app should maintain an app stickiness score of over 20%. And if you seek to make the app as engaging as Facebook and WhatsApp, use a benchmark of 50%.
- Poor performance alone has driven nearly 90% of users to stop using a mobile app. And as it turns out, only 1 in 26 complain when unsatisfied.
- App screen flow metrics are real-world user experience analytics generated after strategically tracking app users as they navigate through different screens.
- Reverse flow analysis reveals the paths users typically take before leaving the mobile app.
- CTR defines the share of mobile app users who proceeded to click (or tap) on an offering after engaging with an ad, post, or promotion.
- In-app videos generate 7.5 times higher CTR than regular display ads.
- Click-through rate (%) = (Total number of clicks / Total reach) X 100
- Click-through is all about the campaign response clicks, while conversion follows when highly-engaged app users finally complete the desired goal.
- Conversion rate (%) = (Number of users who performed the target activity / Total volume of users) X 100%
- The average install-to-purchase conversion rate for in-app banner ads is 3.5%, while native ads generate 4.3%, followed by interstitial ads with 4.2%.
- Bounces occur when users rush to close the app after only experiencing one screen.
- Bounce Rate (%) = (Total number of individuals quitting after accessing one screen / Total number of app users) X 100.
- A page load time of three seconds has a 32% higher bounce probability than one with a one-second load time. And if you stretch it to five seconds, the probability of bounce shoots to 90% over the page loading in one second.
- User retention rate is an indicator of the share of users that you manage to keep as active users long after acquisition.
- On day 30, the global average retention rate per app ranges between 6.2% and 7.2%.
- App Retention Rate (%) = (Total number of users remaining after a specified period / Total number of users acquired at the beginning of the specified period) X 100.
- User retention metrics refine app install figures into a form that accurately reflects your true app growth.
- While app retention rate tracks the number of active users still going strong, app churn rate measures the volume of users withdrawing permanently from the app.
- App Churn Rate (%) = (Number of users who withdrew over a specific period / Total number of app users at the beginning of the review period) X 100.
- User churn rate metrics offer clarity into the aspects that might be compromising user experience within the app.
- Compare your app churn rate with the corresponding user retention metrics to track the net growth rate of your app business.
- 80% of all app users tend to churn within three months.
Newsletter
Don’t miss a thing! Sign up to receive daily news
Subscribe NewsletterMore from App Store Optimization

9 Tips For Perfect App Store Screenshots – With Best Examples
Gone are the days when App Store screenshots were actual “screenshots” in every sense of the word. All you needed to do then was just take basic screenshots of your mobile app and voila! You’d be good to go. Well,...
What is App Optimization Score?
Table of Contents What is App Optimization Score? How Google Ads Optimization Score is Calculated Difference Between Optimization Score and Quality Score Link Between Optimization Score and Google Ads Recommendations How to Increase Your Google Ads Optimization Score What is...