How To Measure Your Mobile App Marketing Strategies

Let’s be honest. Mobile app marketing requires a lot of time and money.
But, is it really worth it? How will you even track its effectiveness to determine the consequent ROI?
PreApps, as you possibly know by now, has successfully marketed more than 3,000 apps. As a result, we’ve received numerous inquiries about our strategies and marketing methods.

That said, one particular question that has popped up on many occasions is this… “How do you manage to accurately calculate your marketing results?”
Well, the answer is pretty simple. We rely on a systematic set of analytics to measure all the variables relevant to the marketing process.
But how?
Ok, here’s the thing. Marketing is basically a tool for building relationships through both social and technical strategies. That alone makes it extensively dynamic, unlike static processes like app development.
So, to get a true sense of how things are progressing, some of the queries that might come up include:
- Who is interested in your app?
- Why are they downloading it?
- Are they even using it after installation?
- How has the latest keyword adjustment improved the number of downloads?
Such questions ultimately help you determine what’s working and what’s not. As a result, you’ll be able to adjust not only your marketing framework but also the app for the best possible results.
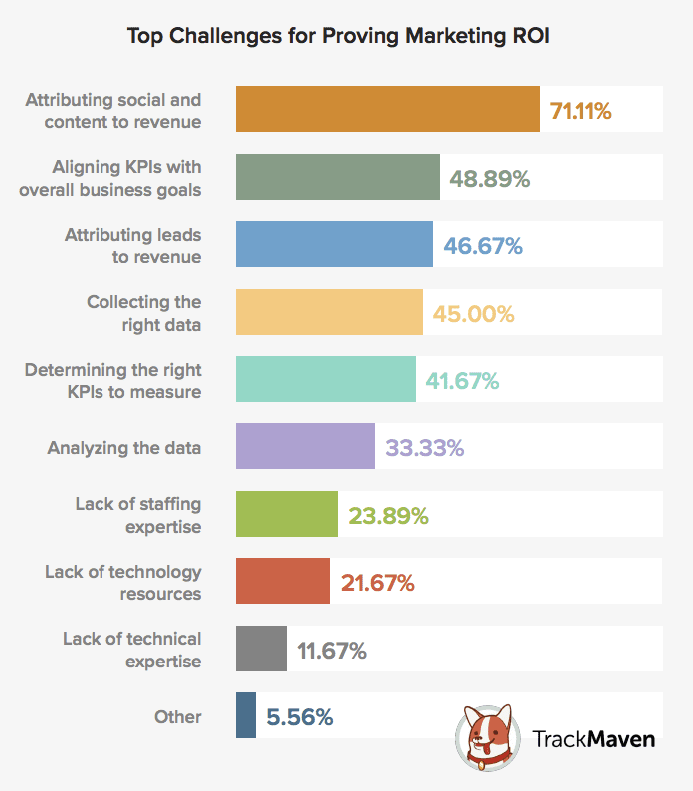
But this is often easier said than done. Even the most experienced marketers have trouble tracking ROI accurately. According to a survey from Smart Insights, marketers struggled most with attributing channels to revenue and collecting the right data.
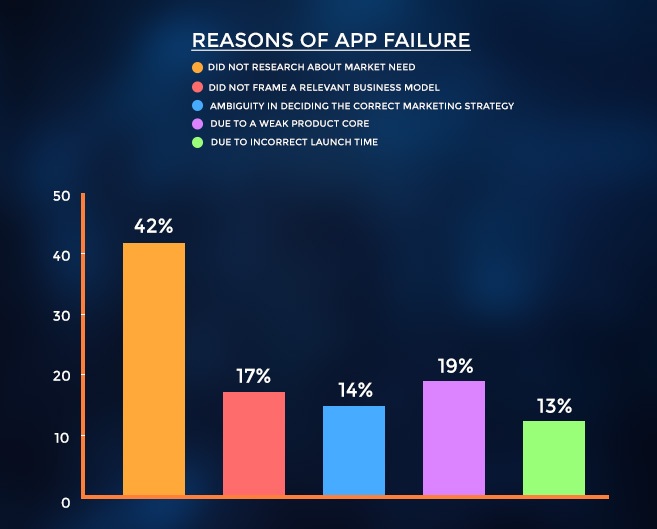
Marketing an app effectively is critical to its success – and its survival. According to a Gartner study (reported on Business of Apps), some of the leading reasons why apps fail is due to a lack of adequate app marketing and market research,
The truth is that measuring mobile app marketing goes deeper than just the sales numbers. It systematically breaks down the overall impact into metrics that tell the whole story. This allows you to comprehensively assess the ROI from all possible angles.

App Marketing Analytics vs. In-App Analytics
Mobile app marketing analytics assesses the “big picture” by providing a detailed outlook of the individual channels being leveraged.
In-app analytics, as the name implies, are only concerned with elements within the app. It provides data on app performance and user interaction, without necessarily expounding other aspects beyond the precincts of the app itself.
1. App Marketing Analytics
All things considered, comprehensive app marketing campaigns are basically a combination of multiple prelaunch app marketing and post-launch promotion tactics working in tandem to reach out to the target audience.
App marketing analytics is usually embedded into this pipeline to provide detailed assessments of each critical variable. And the deeper the marketing metrics go, the higher the accuracy of the corresponding insights.
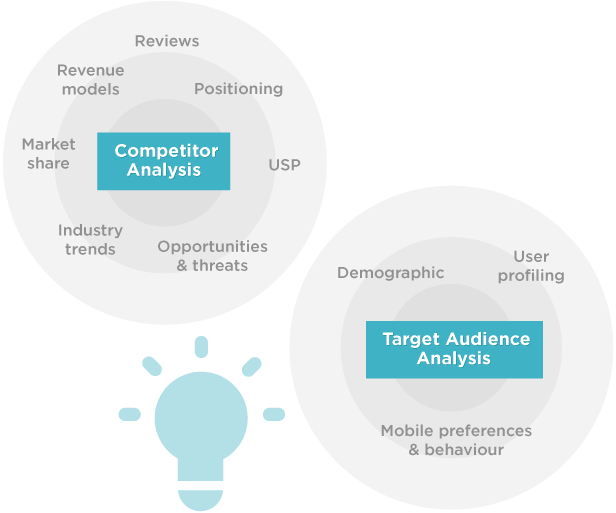
That’s why, as a matter of fact, it’s always advisable to go beyond your target audience and extend the analysis to cover even your competitors’ strategies.
2. In-App Analytics
In-App analytics gives you an insight into how your app is performing and how users are interacting with it. This set of indicators is often completely different compared to variables employed in marketing evaluation.
What does this mean?
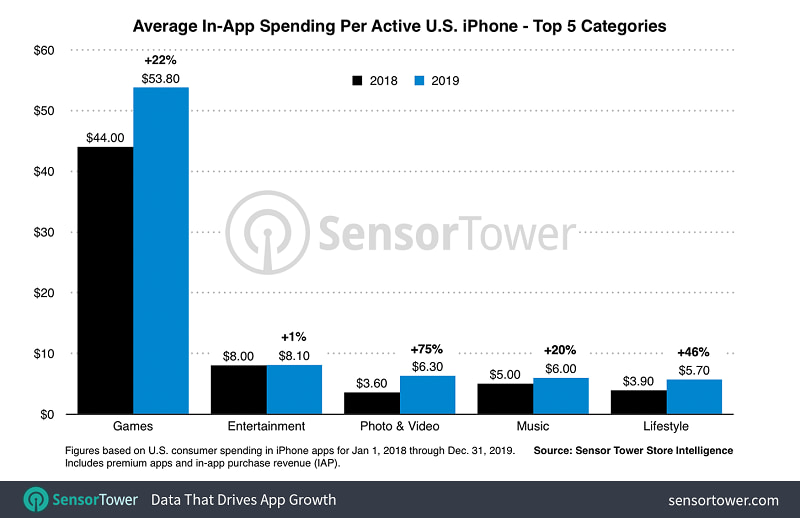
Well, take a look at the following example of in-app analytics. It basically defines the average amount spent by app users across different categories. Depending on what type of app you are creating, your numbers could be completely different than the national average!
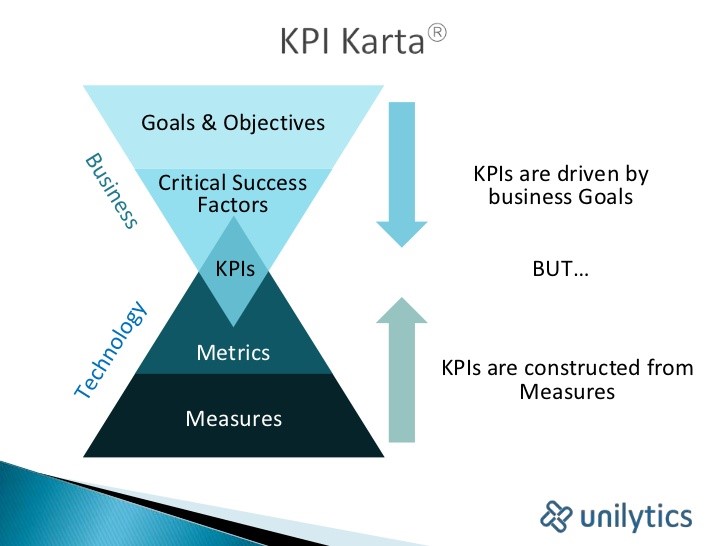
App Marketing Metrics vs KPIs
Another set of terms you’ve probably come across in the app tracking space is app marketing metrics and Key Performance Indicators (KPIs).
Could it be one and the same thing?
Technically, metrics can also be defined as performance indicators and vice versa. But, interestingly, the term “key performance indicators” refers to a different thing altogether.
1. App Marketing Metrics
Mobile app marketing metrics refer to values that define the actual performance levels of your campaigns. Quite simply, each indicator qualifies to be a metric.
We’re talking about things like:
- Average Sessions Per User
- Cost Per Click
- Cost Of Marketing
- Click-Through-Rate
- Cost Per Ad Impressions
- Quality and Relevance Score
- Number of Clicks
- Overall Reach
- Number of Impressions
2. App Marketing Key Performance Indicators
All app marketing KPIs are actually metrics, but not all metrics qualify to be KPIs.
Key Performance Indicators involve a special level of recognition reserved only for a unique set of metrics. These are exceptionally critical to the overall performance of your mobile app marketing campaign.
While some metrics, like the number of app downloads, are applicable as KPIs across the board, there are no industry rules on what qualifies and what doesn’t. Your choice of KPIs depends on your specific situation and objectives.
For instance, an app that uses international geolocation marketing to generate revenue might implement Reach-Per-Country as a KPI. A similar version that only deals with the U.S, on the other hand, would only be concerned with the reach-per-state numbers.
That said, here’s a list of some important mobile app marketing metrics that are often adopted as Key Performance Indicators:
- Acquisition/downloads
- Activation
- Retention
- Referral
- Lifetime Value
- Cost Per Install (CPI), Cost Per Loyal User (CPLU)
Critical App Marketing Metrics
1. Acquisition/Downloads
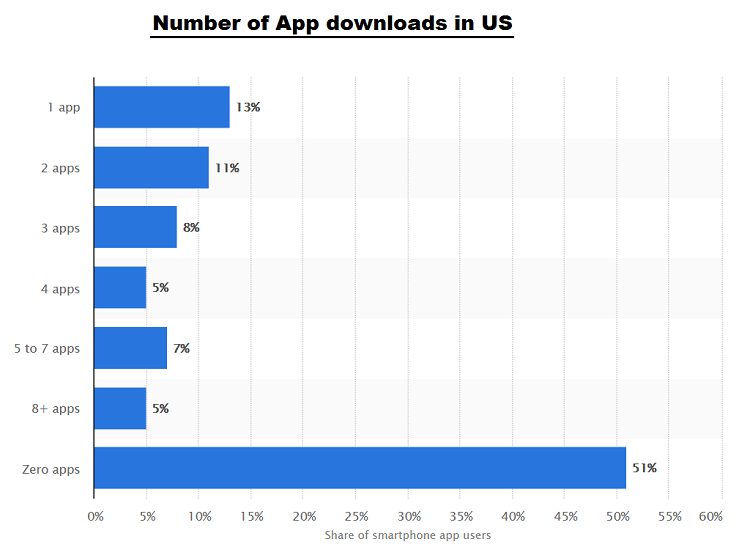
The number of downloads and the corresponding rate of installation, on the other hand, are useful indicators of your app’s performance against its competitors. More than half of Americans do not download apps on a regular basis – so you need to be quite convincing to get them to make that jump.
The Acquisition involves the entire process of driving users to your App Store page and convincing them to download the app. As a metric, this encompasses not only the number of downloads, but also your users’ profile, source, and response rate.
If you define the type of users your app is attracting, you’ll be able to establish your target niche, and subsequently optimize your app marketing strategy. Similarly, assessing where the bulk of your users are coming from (like app review sites) will help you find the best places to hunt for prospective users.

2. Activation
Activation is what comes after installing the app. It defines the number of users who proceed to actually use your app after downloading and installing it.
Apart from pre-download engagement elements like the app demo video, the activation rate largely depends on the value your app provides.
Eventually, the activation rate indicates the number of users your app had the chance to make a first impression on.
3. Retention
This is, by far, the single most relevant metric for defining the longevity or long-term success of your app. It refers to the number of users who repeatedly come back to your app over the long haul.
While activation focuses on the first impression, the rate of retention is largely determined by the value offered by your app on a consistent basis.
A high retention rate means users are loving the app and are finding it increasingly useful in their daily lives. A low one, on the contrary, means that your app is barely providing value to its users.
But, what exactly is a low retention rate?
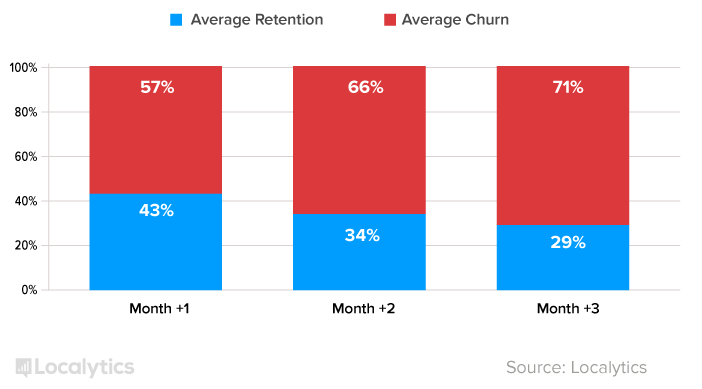
Well, here’s the thing. As of 2019, the average user retention rate stood at 43% in the first 30 days, 34% in 2 months, and 29% in 90 days.
Anything below that, therefore, is a relatively low retention rate.
4. Referral
If recent trends are anything to go by, marketers are increasingly capitalizing on existing app users to pass the word around. And that’s precisely what’s measured by referral analytics. It simply defines the ratio of users who’ve brought in new users by sharing the app.
To maintain a high referral rate, consider offering thoughtful and alluring enticements for each referral/share that translates into a successful installation.
5. Lifetime Value
Retaining a user over the long haul essentially translates into extended revenue opportunities. The consequent measure is called lifetime value, which refers to the total amount of revenue generated by a user in the entire life cycle of the app.
While an app like Uber calculates lifetime value based on amounts spent by its users, Facebook evaluates the amount of revenue generated from ads viewed by respective users.
That said, a good way to maximize the lifetime value is by offering redeemable loyalty points based on the cumulative amount of value generated by each user.
6. Cost Per Install (CPI), Cost Per Loyal User (CPLU)
If paid ads were part of your app marketing, you’d want to understand their consequent value in terms of money spent to acquire each user.
Cost Per Install, otherwise commonly referred to as CPI, is evaluated by dividing the total amount of money spent on ads by the number of resultant app downloads.
Cost Per Loyal User, on the other hand, refers to the average amount of money spent on ads for each retained user. It’s established by dividing the total expenditure on paid ads by the number of acquired users who repeatedly use the app.
Therefore, to adequately examine the overall ROI of the paid ads, compare the CPLU with the corresponding average lifetime value per user.
Key Takeaways
- Fact is – measuring mobile app marketing goes deeper than just the sales numbers. It systematically breaks down the overall impact into metrics that tell the whole story.
- In order to accurately measure app marketing results, you need to know which metrics to track.
- First, you must separate mobile app marketing analytics (“big picture” assessments) from in-app analytics (elements within the app)
- You must then define the mobile app marketing metrics that pinpoint the actual performance levels of your campaigns.
- Key Performance Indicators are a special level of recognition reserved only for a unique set of metrics that are exceptionally critical to the overall performance of your mobile app marketing campaign.
- You should also track acquisition (the process of driving users to your App Store page, then convincing them to download the app) and activation (defining the number of users who proceed to actually use your app after downloading and installing it)
- Keep a close eye on retention, which refers to the number of users who repeatedly come back to your app over the long haul.
- Track referral, which is the ratio of users who’ve brought in new users by sharing the app.
- Lifetime value is important, as it is the total amount of revenue generated by a user in the entire life cycle of the app.
- Measure the Cost Per Install, otherwise commonly referred to as CPI, by dividing the total amount of money spent on ads by the number of resultant app downloads.
- Finally, track Cost Per Loyal User to determine the average amount of money spent on ads for each retained user. It’s established by dividing the total expenditure on paid ads by the number of acquired users who repeatedly use the app.

Conclusion
The only way to truly determine just how successful your app launch goes is by knowing which marketing metrics to track and how to properly calculate the numbers. Otherwise, your estimation will be a shot in the dark.
Successful marketing campaigns do not happen by accident – they are closely monitored and adjusted as needed based on the numbers. Although many developers and marketers find it quite challenging to accurately measure ROI and results, you simply need to know what to look for and how to find it.
Newsletter
Don’t miss a thing! Sign up to receive daily news
Subscribe NewsletterMore from Mobile App Marketing

Mobile App Marketing Guide: The 2025 Trends and Facts
We’ve taken a step back and reviewed all the events, trends, technologies, and strategies that are shaping the mobile app marketing industry in 2025. Table of Contents: Mobile App Marketing Statistics - What To Expect In 2025 #1. Your Competitors...

Launching A Mobile App: The Complete Guide To Early Success
Launching an app is by far one of the most exciting moments for app developers and app owners. The mobile app launch is like a long-awaited sigh of relief to culminate the commonly tedious mobile app development journey. Table of...